RELATIVE VALUE IN TREASURY MARKET
U.S. Treasuries have long been considered to be among the safest and most liquid assets in the world. However, the market structure has become increasingly rigid over the last decade. Regulations enacted in the wake of the Global Financial Crisis have decreased primary dealers’ incentive to allocate balance sheet to Treasury securities (Figure 1). Even as Treasury bond issuance has ballooned, primary dealers have reduced their risk appetite in the asset class during times of stress.
PRIMARY DEALERS’ FOOTPRINT IN TREASURIES HAS SIGNIFICANTLY LAGGED GROWTH IN PUBLICLY HELD DEBT
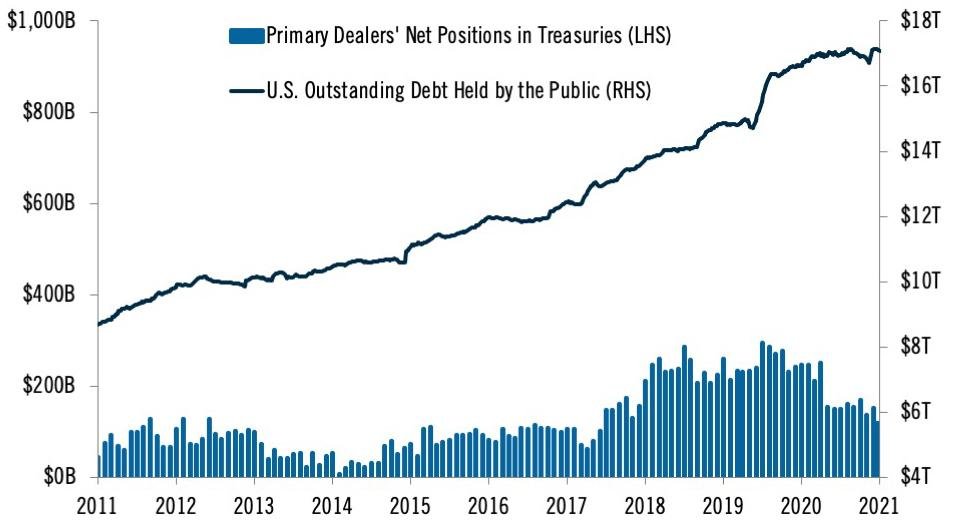
Source: PGIM Fixed Income and the U.S. Federal Reserve as of September 30, 2021. Outstanding debt excludes Fed holdings.
Primary dealers’ aggregate balance sheet currently represents a relatively small portion (~$200 billion) of a Treasury market that has outstanding debt of nearly $18 trillion.1 The following simplified scenarios show how the market should function under normal conditions and under strained capacity during periods of stress:
1. A normal functioning market: An owner of a Treasury bond contacts a primary dealer and asks for a bid on $1 billion market value of a specific Treasury security. The dealer buys the security, hedges the risk, and holds the bond on its balance sheet for a period before selling to a buyer at a higher price. On balance, the dealer’s balance sheet size stays constant, and the resulting bid-ask spread becomes the dealer’s compensation for expanding balance sheet usage and taking on the risks associated with holding the bond.
2. A market under stress: The owner contacts a primary dealer and asks for a bid on the same bond. The dealer buys and holds the security on the balance sheet but, given the market stress and investors’ desire to raise liquidity, the dealer is soon asked by another customer to bid another $1 billion of the same security. The dealer’s balance sheet grows with each trade as it fails to offload these securities, and primary dealers in general quickly find themselves reaching the limit of their risk tolerance. Consequently, $200 billion of net selling in the market — or 1% of Treasuries outstanding — could be enough to overwhelm the balance sheet capacity of primary dealers.
Scenario 2 is an overly simplified example of market conditions during the onset of the pandemic in March 2020, although the scale of the selling was significantly more sizable. The volatility of the pandemic-related selloff was greatly exacerbated by dealers’ inability to meaningfully increase balance sheet usage as Treasury investors aggressively sold bonds to raise liquidity.
Unlike March 2020, the recent selloff has been triggered by abnormally elevated inflation data, which challenged the propriety of extreme central bank accommodation. As potential rate hikes suddenly became priced in globally, investors rapidly sold bonds to unwind crowded steepening carry trades. Investors who typically use large amounts of leverage were stopped out of directional trades and dealers were once again reluctant and/or unable to absorb risk. The selloff in front-end rates became self-fulfilling as liquidations and stop-outs spread to other types of investors.
The forced unwinds of leveraged investors created unprecedented dislocations in various parts of the Treasury market and resulted in attractive relative value opportunities.
THE RICHENING OF OLD 10-YEAR BONDS
The Treasury regularly issues new government bonds monthly or quarterly, depending on the maturity. In normal market conditions, investors have a defined preference for the most recently issued bonds, known as on-the-run securities. The premium investors are willing to pay for such securities relative to other bonds of similar maturity is known as the “liquidity premium.” One way to measure the liquidity premium is to calculate the spread of the on-the-run security against an interest rate derivative and compare that to those of similar securities.
Since on-the-run bonds tend to be more liquid and offer lower transaction costs, the liquidity premium normally rises and asset swap spreads widen during periods of stress. For example, in March 2020, the asset-swap spread between old off-the-run 10-year Treasuries issued in 2019 and on-the-run seven-year notes rapidly widened, creating a 5+sigma event.
In late 2021, we witnessed an unprecedented counter-reaction. Forced unwinds of leveraged positions drove the asset swap spread to quickly compress, leading to a significant richening of off-the-run securities. We believe many macro funds were forced to purchase these eight-year notes — which were already trading rich — in order to cover short steepener positions, contributing to the relative-value anomaly in this localized segment of the curve. The extreme liquidity premium quickly reverted in March 2020, and we believe mean reversion will again prevail as the value of the off-the-run notes cheapens over time.
THE CHEAPENING OF 20-YEAR BONDS
Cross currents at the long end of the Treasury curve also created sizable relative-value opportunities. Since its re-introduction in May 2020, the 20-year bond has traded poorly relative to similar maturities. One way to gauge the relative undervaluation of the 20-year bond is to compare it with Treasury futures of similar maturity. Recent disruptions in the market and large liquidations of the 20-year sector have further amplified the relative cheapness in the bond, creating a 4.4 standard-deviation move in late October. The U.S. government is acutely aware of the relative cheapness of the 20-year bond and has recently taken several steps to alleviate the supply-demand imbalance.
In 2020, to fund COVID-related fiscal stimulus, Treasury rapidly increased bond issuance and disproportionately increased supply in the 7- and 20-year sectors. The overwhelming supply outstripped demand and has led to the relative cheapness exhibited in those two securities since. The recent, rapid economic recovery alleviated Treasury’s need to issue as much debt. Consequently, Treasury officials cut issuance across all maturities and disproportionately reduced supply in the 7- and 20-year sectors, and further signaled the potential for more reductions in the upcoming quarters.
Furthermore, the Federal Reserve, which has been buying Treasuries as part of its quantitative easing program, has announced an accelerated tapering of its purchases amid the ongoing economic recovery. The Fed announced that it would reduce purchases by $20 billion a month, and it previously indicated that it would purchase fewer bonds in all maturities except the 20-year bucket. The Fed’s continued sponsorship of the sector, combined with decreased supply, should alleviate the relative discount of the 20-year bond.
Finally, the Chicago Mercantile Exchange has also joined the effort to improve liquidity and recently unveiled prototypes for a potential futures contract tied to the 20-year bond. U.S. Treasury futures tend to be among the most liquid instruments in the world, and a potential 20-year contract would help enhance investor demand.
At a time when investors confront historically tight credit spreads and stretched equity valuations, rare relative value is left waiting to be captured in the US Treasury market. The emergence of these market anomalies stems from the intermediation challenges faced by the Treasury market, but the normal relationships between these highly correlated bonds should stabilize with time, as they have in the past.